

Approaching TAM, SAM & SOM: Sizing as Strategy, Not Theater
WRITTEN By Fluvio Lead consultant, Nick Moore
Few things a product marketer builds carry more strategic weight than a market sizing.
Built well, a TAM/SAM/SOM gives the company a shared, defensible picture of the opportunity. It says which buyers are real, what they'll switch away from to choose you, what they'll pay, and how much of that you can actually win. Every territory plan, pricing tier, and roadmap bet inherits those answers.
Built poorly, the same exercise warps every decision downstream, from the ICP sales can't close, to the segment the roadmap overbuilds for, to the pricing tier that just sits there.
The three layers are simple enough on paper:
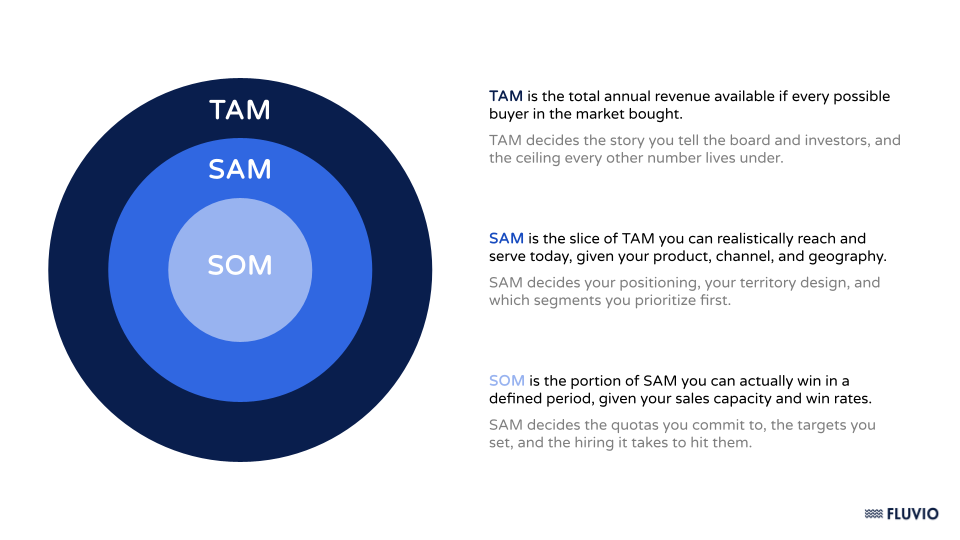
TAM is the total annual revenue available if every possible buyer bought.
SAM is the slice of TAM you can realistically reach and serve today given your product, channel, and geography.
SOM is the portion of SAM you can actually win in a defined period, given your sales capacity and win rates.
Most product marketers stop at producing the number, but the leverage is in operationalizing it: pulling sizing into product reviews, pricing decisions, and GTM planning until it changes what the company does.
Strategic market sizing is arguably the most direct lever product marketing has on company strategy, and most product marketers never pull it.
The Craft: Three Methods
Market sizing comes down to two core methods you deliberately run against each other, plus a third you keep in reserve.
Top-down starts from an analyst-sized market and filters down by geography, segment, and ICP. It's fast and finance understands it instantly, which is exactly why it's dangerous: it produces a confident number with no selling motion behind it.
Top-down is good for a quick ceiling. It can rough out a TAM and, with enough filtering, gesture at a SAM. It can’t tell you whether you can reach a single one of those accounts or win a single deal, which makes it silent on SOM, the only layer tied to what your team can actually execute. Use it to sanity check a real build rather than stand in for one.
Bottom-up inverts the logic: number of target accounts multiplied by annual contract value. It's slower and far more revealing, because you can't build it without making concrete decisions about who you sell to, at what price, and through what channel.
A serious bottom-up build produces all three layers honestly. Accounts times ACV gives you TAM. Filtering to the accounts you can displace gives you SAM. Applying your win rate and sales capacity over a set timeframe gives you a SOM you can defend in a budget meeting. The bottom-up model is a GTM plan with dollar signs attached.
Top-down and bottom-up are two angles on the same market, and you run both precisely so they can disagree. When the top-down ceiling and the bottom-up build don't line up, one of your assumptions is wrong, and the size of the gap tells you how wrong.
The third method, value theory, is for one specific situation: when there's no comparable product to price against. With no market price to anchor to, you work backward from the value you create. Estimate what the product is worth to a buyer, then ask what share of that value they'd pay to capture.
Whichever method you choose, the deliverable isn't the final number. It's the set of claims you had to make to get there, and the ones you now have to defend in front of finance, sales, product, and the executives who'll fund the plan.
One Market, Three Answers
Say you're a product marketer at a B2B SaaS company selling compliance automation software to mid-market financial services firms in North America.
A top-down sizing exercise might start with an analyst estimate of the global GRC (governance, risk, and compliance) software market, call it $15B. Filter to North America (40%), mid-market (25%), and financial services (20%). That lands at roughly $300M. It's a clean “TAM-shaped” number you can produce in an afternoon, and it tells you almost nothing about how you'd capture a dollar of it.
A bottom-up build starts from accounts. You identify 4,200 mid-market financial services firms through a data provider at an average ACV of $85K. That's a TAM of $357M: close to the top-down figure, but grounded in companies you could name. The rough convergence is itself information: it says both builds are at least living in the same reality.
Filter to the 1,800 firms still running manual, spreadsheet-driven compliance processes (the buyers you can actually displace) and your SAM is $153M. Apply your real win rate and sales capacity over the next 18 months and your SOM lands around $12M. That progression is the useful part: it shows that more than half your “market” isn't ready to switch yet, and that even the reachable slice is years of selling away from being won.
Value theory pressure tests the number the bottom-up build took for granted: your $85K price. Each of those 1,800 firms spends roughly $220K a year on manual compliance labor and audit remediation, and your software exists to eliminate that spend.
But buyers don't pay the full value you save them, just a fraction of it. If they'll part with 30 cents on the dollar, that points to a price near $66K, below the $85K you charge today. That gap is a warning: your price may be running ahead of the value buyers can see, which means your sales team is about to start discounting, or you need to sell more value per deal.
So the methods produce different numbers, and the numbers don't average into truth. The gaps between them are the assignment.
The $85K vs. $66K spread is a pricing question you have to answer before finance bakes the higher number into the model. The 4,200 vs. 1,800 spread is a sequencing question: who do you chase first, and what has to become true before the other 2,400 accounts are real? Answer those two well and you've done more strategic work than any single headline number could carry.
Where It Goes Wrong
The most common failure is also the most transparent: a giant denominator and a rounding error share. Name a massive market, claim you only need 1% of it, and call the result inevitable. This is sizing as theater: a number built to be admired, not acted on, and it's almost always self-defeating, because any sophisticated audience reads it as a signal that you skipped the real work.
The more subtle failures cost more, and they hide in each layer.
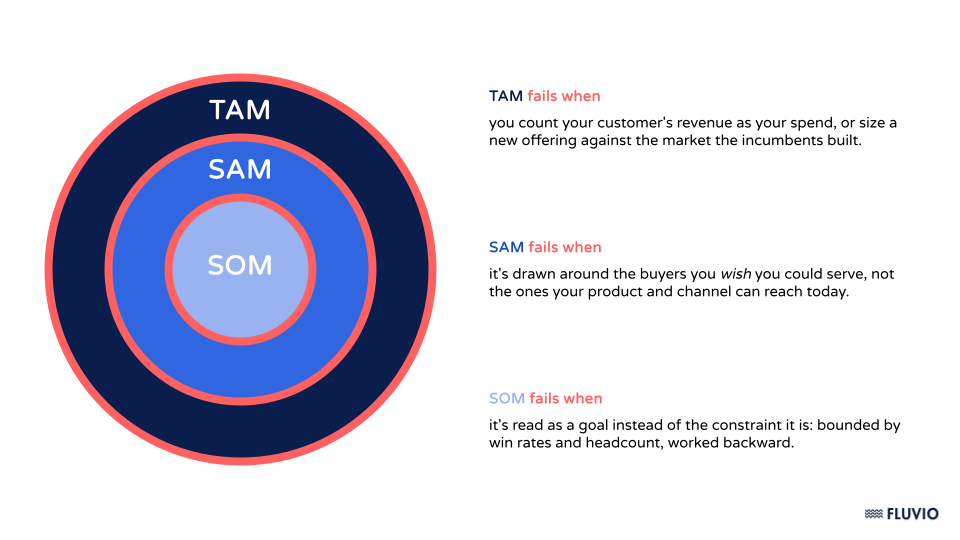
At the TAM layer, the classic error is mistaking your customer's revenue for your own addressable spend. The compliance company above doesn’t have its customers' revenue, or even their full IT budgets, as its TAM. It has the budget those firms will put toward compliance software: the $85K per account ACV the bottom-up build assumed, and nothing larger. Get this wrong and you do more than inflate a slide, you hand sales an ICP full of accounts that were never real prospects.
The other TAM trap is treating the market as fixed. This is the “horses in 1910” problem: when you size a new offering (cars) against the market the incumbents built (horses), you miss the market the new offering creates. Anchor your TAM to last year's analyst report and you'll systematically undercount anything genuinely new about what you've built.
The SAM layer’s failure mode is quieter because it looks like optimism. Product marketers routinely draw SAM around the buyers they wish they could serve rather than the ones their product, pricing, and channel can reach today. If your product requires an integration that only a third of those 1,800 firms have, your real SAM is 600 accounts, not 1,800. A SAM built on aspiration sets quotas and territories that can't be hit, and the miss gets blamed on sales.
The SOM layer fails when it's read as a goal rather than the constraint it actually is. SOM is bounded by how many deals your team can run and close in the period. Treat it as a number you'd like to hit and you'll commit to something your capacity can't physically produce, then spend a year explaining the shortfall. A credible SOM starts from win rates and headcount and works backward.
Then there's the failure that should embarrass the discipline: stopping at TAM entirely. TAM gets the headlines; SAM and SOM get the budget. Segment prioritization, territory design, and pricing logic all live in the lower two layers. Leave them undone, or leave them to finance, and product marketing has handed away its most direct path to influence.
Where Sizing Turns Into Strategy
Everything strategically useful about sizing lives in what you do with the numbers, not in the numbers themselves. Three uses carry the most weight, and each one rests on a different layer.
TAM as Politics: The Two Numbers Every Company Keeps
Most companies keep two TAMs, even if nobody says so out loud. The narrative TAM is the big, expansionary number for board decks and investor days. The operating TAM is smaller and segment specific, built from real ACV, and it's the number behind quotas, territories, and pricing tiers. Pretend only one exists and you lose credibility with whichever audience catches the mismatch first.
Getting the number right matters less than knowing which number belongs in which room, and never confusing them. Bring the narrative TAM into a quota conversation and the CRO stops trusting you. Bring the operating TAM into a board narrative and you look like you're thinking too small. The product marketer who moves fluently between the two, and who flags the gap before someone else weaponizes it, becomes the person finance and sales rely on for anything market related.
SAM as Positioning: The Number You Choose by Choosing a Category
The SAM you claim is your positioning, written in numbers the rest of the company can act on.
For example, Gong started in a category called “conversation intelligence,” but when it pitched that to senior revenue leaders, the reaction was that it sounded like a tool for sales enablement, not something a CRO needed to care about. So Gong renamed the category “revenue intelligence.”
That was no messaging refresh. It changed the buyer, the budget line, and therefore the SAM. The sizing didn't follow the positioning decision. It was the positioning decision.
The category you choose to compete in sets the criteria buyers use to judge you, which sets who the buyer is, which sets what they'll pay. A product positioned in a $2B niche where it can credibly claim 15% share tells a completely different story than the same product positioned as a rounding error in a $40B horizontal market.
Choosing a SAM is choosing a buyer, a competitive frame, and a price point all at once. That makes positioning less a branding exercise than a sizing decision, and one of the most consequential the company makes. It belongs to product marketing.
SOM as Roadmap Influence: Sizing What You Can Actually Win
A product marketer who walks into a roadmap review with segment-level numbers turns prioritization from a contest of opinions into a question of evidence. The basic move is to size what each option on the table would unlock.
Recall from the SAM discussion that only about 600 of those 1,800 compliance prospects can adopt the product today; the other 1,200 run on legacy core banking systems it doesn't yet integrate with. Say the team is choosing between building those integrations and overhauling the reporting dashboard. The integrations would open the roughly 1,200 blocked accounts at $85K ACV, close to $100M in new SAM, while the dashboard would lift retention but add no new accounts. On those numbers, it looks like an easy call.
The sharper move is to size the obtainable slice, not the theoretical one. That $100M means nothing if sales can't work it inside the planning horizon: run it through your win rate and the capacity you’d realistically add alongside the build, and the incremental 18-month SOM is closer to $8M. If headcount stays flat, it's smaller still, because the same reps are already working the existing SAM, which means the sizing has surfaced a hiring decision as well as a roadmap one.
That doesn't sink the integration case, but it reframes the decision as $8M of winnable new business against the retention the dashboard protects, not $100M against nothing. That's a tradeoff product can actually decide on, which is why SOM, the one number bounded by real capacity, is the layer product trusts.
How To Present Sizing So It Lands
Rigor is wasted if the analysis dies in a slide nobody acts on, which is what usually happens. The numbers get presented as something to admire rather than a claim to act on. Because sizing only turns into strategy at the moment it changes a decision, getting it into the room matters as much as getting it right. Four things help.
Lead with the operating number, not the narrative one.
Executives have seen inflated TAMs before. Opening with the SAM or SOM, the number tied to this year's targets, buys you credibility. Save the expansionary TAM for the part of the story that's actually about expansion.
Show the build, not just the output.
Walk through the logic: how many accounts, at what ACV, filtered by what. The assumptions are where the real conversation happens. When a VP of Sales challenges your account count or a CFO questions your ACV, that's not friction, but the alignment you came for, happening live.
Name what you're leaving out.
The most persuasive analyses show discipline. “We excluded these 1,200 accounts because they lack the integration our product needs” signals rigor in a way no headline number can. Exclusions prove you did the work.
Tie every number to a decision.
A SAM in isolation is trivia. A SAM that implies a territory plan, a pricing tier, or a segment to walk away from is strategy. If a number on your slide doesn't change a choice someone in the room has to make, cut it.
Own the Number, Own the Strategy
Almost every product marketer will build a TAM at some point. Very few will use one to change how their company sees its own market, and the gap between those two groups has nothing to do with analytical skill. It's about what you think the deliverable is.
One more thing separates the two groups: strategy gets revisited. A sizing has a shelf life, and it expires the moment the assumptions underneath it move: a repricing, a new category, an integration that unlocks a blocked segment. Rebuild it at least annually, and any time positioning or packaging changes, because a number nobody updates becomes reporting no matter how rigorously it was built.
If the deliverable is a number, you're doing reporting, and reporting gets filed and forgotten. If it's an argument about who's worth selling to, what they'll pay, where to compete, and what to build next, you're doing strategy. Make that argument, and the number is yours. So is the strategy built on it.